Note
Click here to download the full example code
Creating the Mandelbrot Set with colors
Some setup
import chaoseverywhere as chaos
import matplotlib.pyplot as plt
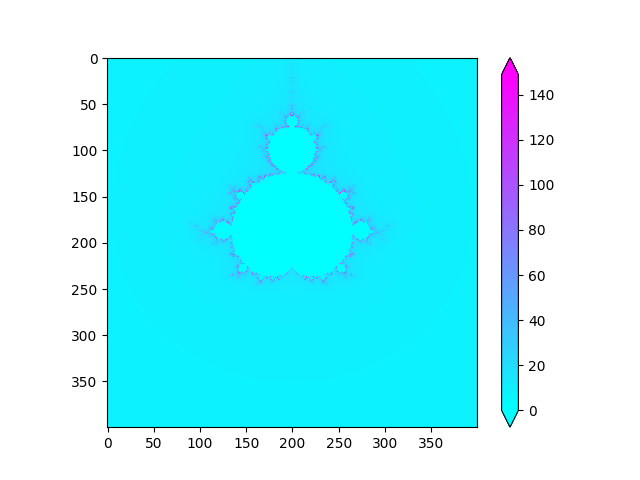
Colored Mandelbrot
The second easiest way to see the Mandelbrot is not only to consider the points which are in the set, but also categorize how fast the others diverge. It is well known that the Mandelbrot set is contained in the origin disk of radius 2 \(D((0,0),2)\), so we just iterate the formula :
with \(z_0=0\in\mathbb{C}\). And the twist here is to change the value of the points whose modulus is beyond 2. Let’s consider that we affect it with the value of the current iteration. For that and because it can be time consuming to calculate the modulus of numbers in an array (mainly because of the square root), we use the formula :
And then, we don’t compare it with 2, but \(2^2\).
mandel = chaos.Mandelbrot_disp(0,0,2,t_max=150).mandel_loop(go_up=False)
fig, ax = plt.subplots()
pict = ax.imshow(mandel, cmap='cool')
fig.colorbar(pict, extend='both')
plt.show()
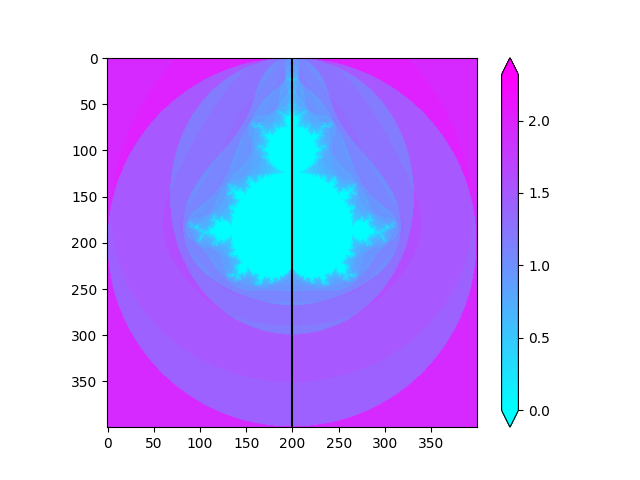
A little better…
The issue here is that chosing the iteration number creates jumps that may be not the smoothest and because \(z_0=0\) and some points take a lot of iterations to make the sequence diverge (the one near the boundary), the constrast is not really visible. In order to correct that, we have a lot of choices, let’s take \(\frac{1}{2+n}\), where \(n\) is the current iteration of the sequence. We can also see that the Mandelbrot set is symmetric with respect to the real axis.
mandel = chaos.Mandelbrot_disp(0,0,2,t_max=150).mandel_loop(go_up=True)
fig, ax = plt.subplots()
pict = ax.imshow(mandel, cmap='cool')
ax.axvline(x=200, color='black')
fig.colorbar(pict, extend='both')
plt.show()
Total running time of the script: ( 0 minutes 0.876 seconds)