Note
Click here to download the full example code
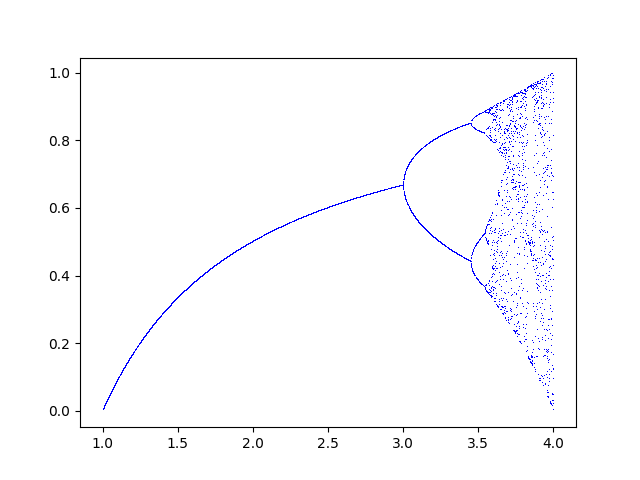
The bifurcation diagram
Link to the logistic map
It is very easy to build the bifurcation diagram of the logistic map. You only need to iterate the logistic map long enough for a value of \(r\) (\(x_{n+1}=rx_n(1-x_n)\)) and then plot the last point. The goal of iterating the sequence a lot of time is to see where the points are attracted to. If you only need the values of the bifurcation diagram and not the actual plot, only pass the value False to the argument show.
import chaoseverywhere as chaos

chaos.bifurcation(show=True)
An animated visualization
The bifurcation diagram surprinsgly has a link to the Mandelbrot set. Indeed, there is a bijection between the growth ratio \(r\) and value (real part) of \(c\) in the Mandelbrot formula.
Another way to look at it is: if we plot the real part of the iterates of the points in the Mandelbrot set, then we get the bifurcation diagram.
Total running time of the script: ( 0 minutes 8.175 seconds)