Note
Click here to download the full example code
Sparsity over the Mandelbrot set
Some setup
import matplotlib.pyplot as plt
import chaoseverywhere as chaos
Sparsity
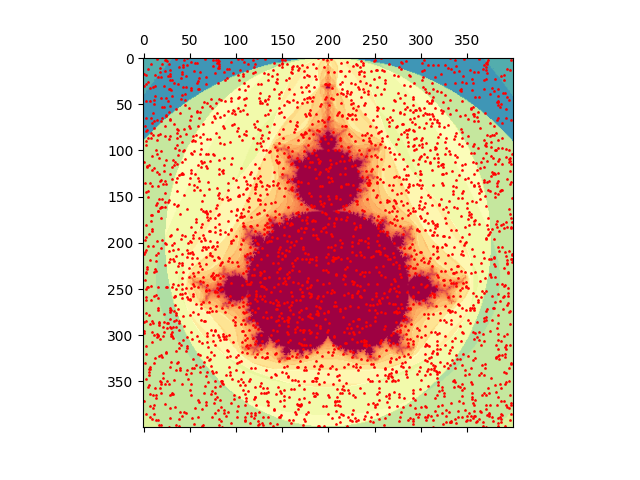
The use of projecting non-zeros values over an area to determine its area is very well known (it’s even how most of us learn the Monte-Carlo algorithm to calculate an approximation of pi). Let’s say someone needs to do the same process with the Mandelbrot set. Then, a simple way to graphically overset the two objets is like below.
fig = plt.figure()
mandel = chaos.Mandelbrot_disp(-.5,0,1.5).mandel_loop(go_up=True)
plt.imshow(mandel, cmap='Spectral')
chaos.sparse_matrix(400,400,.02)
plt.show()
Some values
It can be estimated that the Mandelbrot set has an area between \(1.50\) and \(1.51\). It was proved by Mitsuhiro Shishikura that the Haussdorf dimension of the boundary of the Mandelbrot set equals \(2\).
Total running time of the script: ( 0 minutes 0.373 seconds)